Article by Mark Godlewski
While it is a complex topic, the main tool used by the horticulture industry to judge which healthy plants likely to survive winter conditions is Plant Hardiness Zones. Most nursery plants are assigned a Plant Hardiness Zone based on their ability to survive winters in a given climate. Those zones range from 1-13 and are based on the harshest historical winter conditions averaged over a period of 20 or 30 years. Zone 1 represents the worst winter conditions.
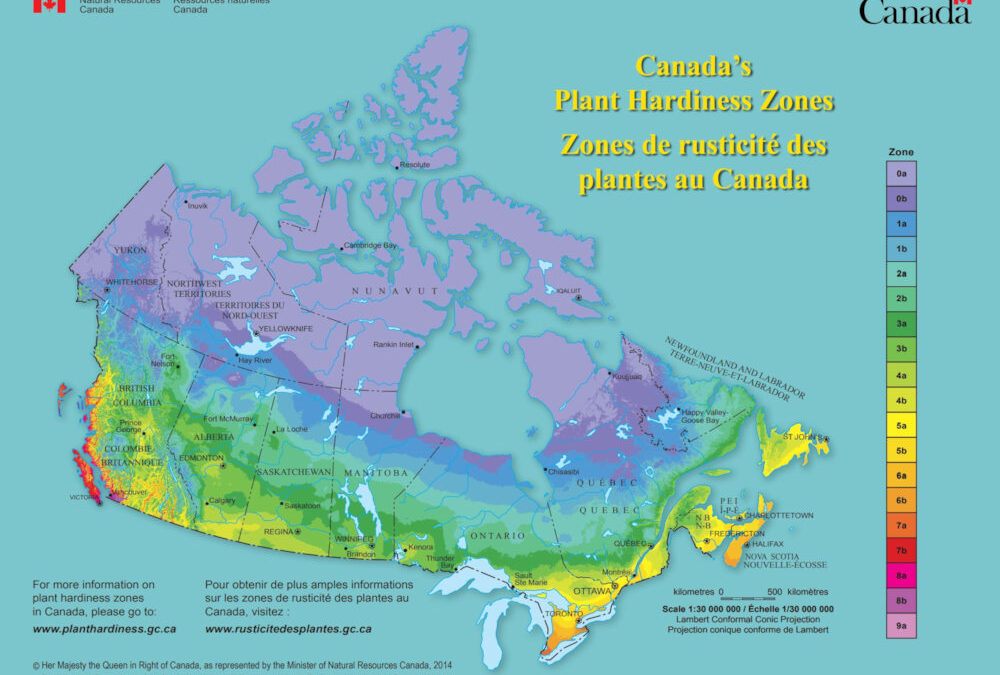
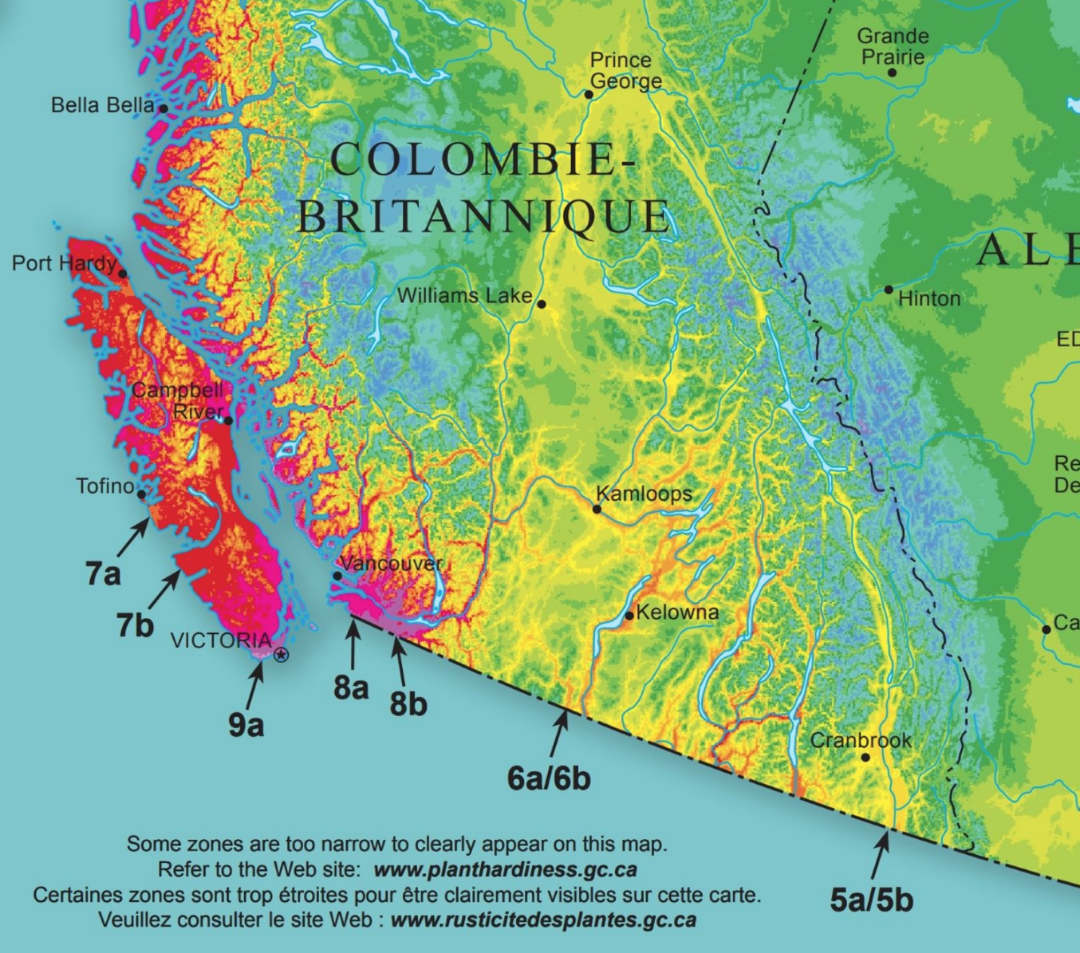
You can see the Government of Canada plant hardiness zones displayed in map form (see Figure 1). These small-scale maps, however, cannot capture local variation. That is why looking up your municipality is a better option using the following Government of Canada website.
Figure 1 – Canadian Plant Hardiness for BC
Typing Kelowna into the website gives you a hardiness of Zone 7a for the most recent period of evaluation (1991-2020). For Armstrong you get a hardiness of 6b. Zone 6b is half a zone colder than 7a. Note, however, that this calculation was done for a 20 year period from 5 years ago and climate variability has become much worse, keep reading.
If you look up a Purple Ice Plant on the OXA website, it tells you that it is hardy to Zone 6. Normally then it should survive winter in any area rated as Zone 6 or higher. Also remember that you can often increase your effective hardiness zone by covering plants with mulch or snow or planting them in an area that is sheltered from the cold like a calm area beside a house.
Complications
Global Warming provides the first complication. We have all experienced generally warmer winters in Canada over the past decades. Okanagan Lake has not frozen over since 1969, whereas it used to freeze over more commonly as in both 1950 and 1949. The Government of Canada website mentioned above compares the period of 1961-1990 to the period 1981-2010 and the zones are all higher on the website for the later date, usually half a zone to a full zone. Note that the Government of Canada is scheduled to come out with an updated plant hardiness zone map later this year.
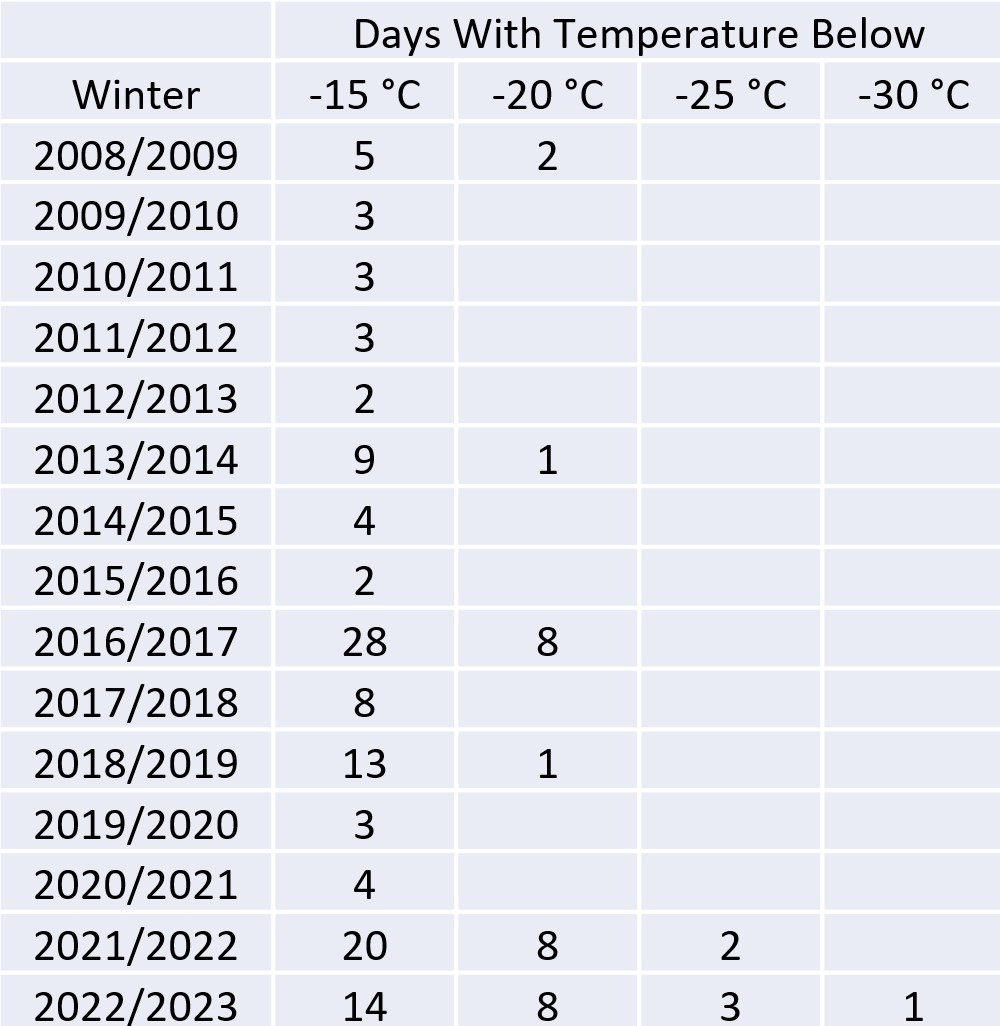
Climate Variability adds a bigger complication. As our climate warms on average, it is also becoming more variable. This means that we are more likely now to have occasional extreme cold snaps. The winter of 2022/23 is a good example of this pattern. At the Kelowna airport we had 2 days at Zone 5 temperatures and 2 days at Zone 4! This resulted in an unusual amount of winter kill for our plants in the Okanagan. Looking at the last 12 years in Figure 2 you can see that these extreme low temperatures are becoming more common. In fact, we just had another extreme cold snap of -30°C in January 2024. It is beginning to look as though we should subtract one to two zones off the maps and lookup tables presented at the beginning of this article.
Figure 2 – Lowest Historical Temperatures for Kelowna Airport
Calculation Methods provide another complication, but it is relatively minor. There are two common calculation methods for hardiness zones. One comes for the USDA and it is based simply on the lowest temperature experienced in a given area averaged over 30 years. The Government of Canada uses a more refined and complex formula which incorporates six other winter weather variables such as snow cover in addition to the lowest temperature averaged over 20 years. Historically the two methods produce similar results in the Okanagan. You can view a map calculated using the USDA method at this website: USDA Zones. This map probably uses data from the period 1978-2008 and there is a lack of topographic detail but it is quite close to the Canadian version. Any differences attributable to calculation method likely be minor compared to the variability from climate change and the time period used for averaging.
Because the landscape industry in the US is so much larger than Canada’s, you can safely assume that any hardiness zone given on a website, or a plant tag is almost certainly a USDA zone. Gardeners in the Okanagan can use the two methods interchangeably.
Microclimates provide the final complication. These are local variations in plant hardiness zones that are generally related to local variations in elevation but can also be caused by the moderating effect of a nearby large body of water. Looking at the zone map you can clearly see the effect of regional variations in topography as the Okanagan is a narrow valley surrounded by high hills and mountains. The higher elevations around our valley have the much lower zone rating of 3a to 3b. At a more local scale we can see an example of a microclimate in the Kelowna area where the airport is about a half to one zone colder than central Kelowna. This seems to be related to both the slightly higher elevation at the airport and the higher elevations that surround the airport. These elevation changes have created channels where the cold air sinks down from the higher elevations.
Summary
Plant hardiness is a relatively simple and important concept for Okanagan gardens, but with climate change it is difficult to predict. Gardeners should take this uncertainty into account in their planting plans.
If you want to try out an interesting perennial rated close to your maximum zone, then it might be worth the risk. On the other hand, if you are planting a tree or hedge that you want in place for a long time, it is better to choose a species two or three zones colder than your maximum.
To avoid disappointment give careful consideration to plant hardiness when selecting plants for your garden.


